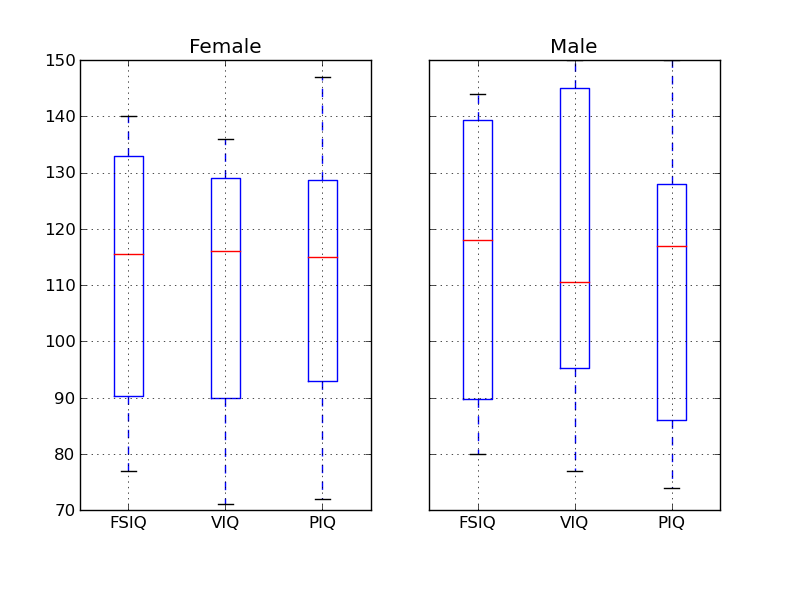
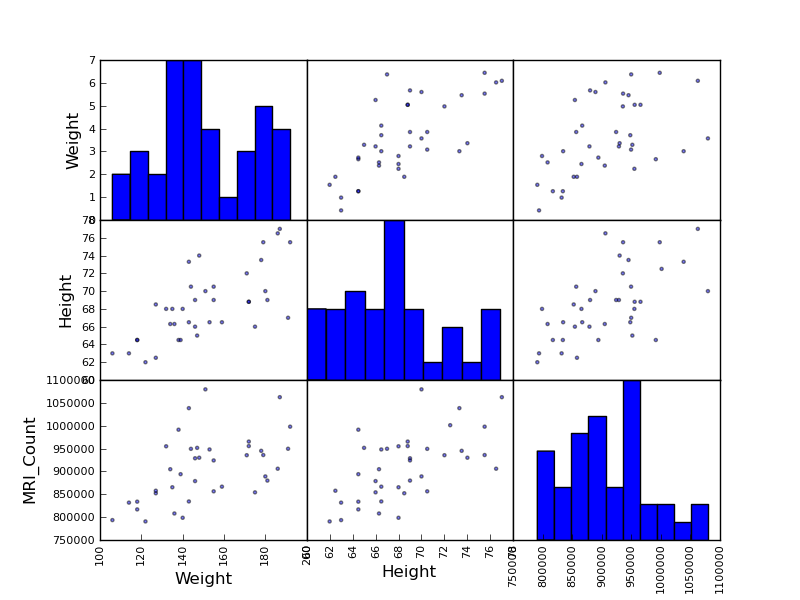
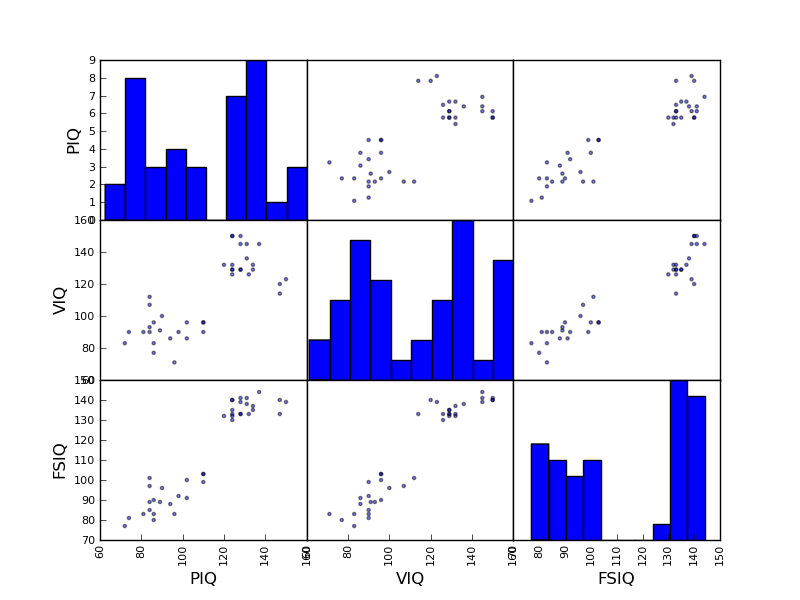
This example loads from a CSV file data with mixed numerical and categorical entries, and plots a few quantities, separately for females and males, thanks to the pandas integrating plotting tool (that uses matplotlib behind the scene).
Python source code: plot_pandas.py
import pandas
import matplotlib.pyplot as plt
data = pandas.read_csv('brain_size.csv', sep=';', na_values='.')
gender_data = data.groupby('Gender')
gender_data.boxplot(column=['FSIQ', 'VIQ', 'PIQ'])
from pandas.tools import plotting
plotting.scatter_matrix(data[['Weight', 'Height', 'MRI_Count']])
plotting.scatter_matrix(data[['PIQ', 'VIQ', 'FSIQ']])
plt.figure(figsize=(4, 3))
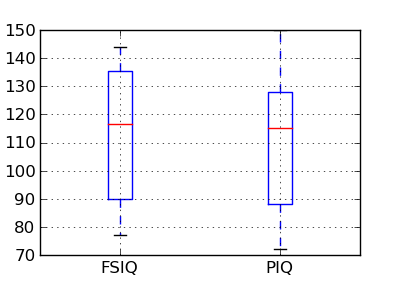
data.boxplot(column=['FSIQ', 'PIQ'])
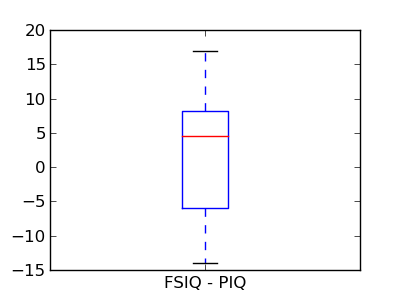
plt.figure(figsize=(4, 3))
plt.boxplot(data['FSIQ'] - data['PIQ'])
plt.xticks((1, ), ('FSIQ - PIQ', ))
plt.show()
Total running time of the example: 1.54 seconds ( 0 minutes 1.54 seconds)
