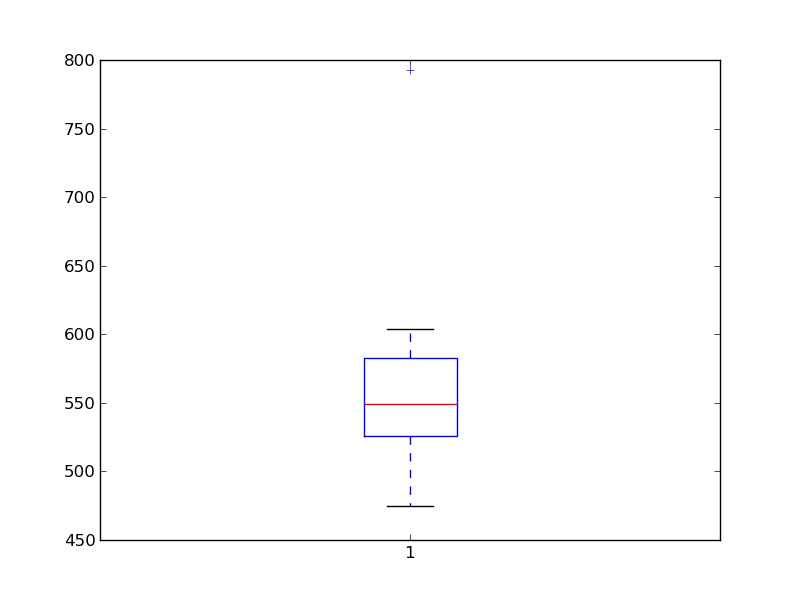
Do a boxplot on numerical data.
Python source code: plot_basic_statistics.py
import numpy as np
x = np.array([474.688, 506.445, 524.081, 530.672, 530.869, 566.984, 582.311, 582.940, 603.574, 792.358])

from matplotlib import pyplot as plt
plt.boxplot(x)

# Show the window
plt.show()
Total running time of the example: 0.15 seconds ( 0 minutes 0.15 seconds)
