The ‘subplot’ command can be used to stack multiple plots in a figure.
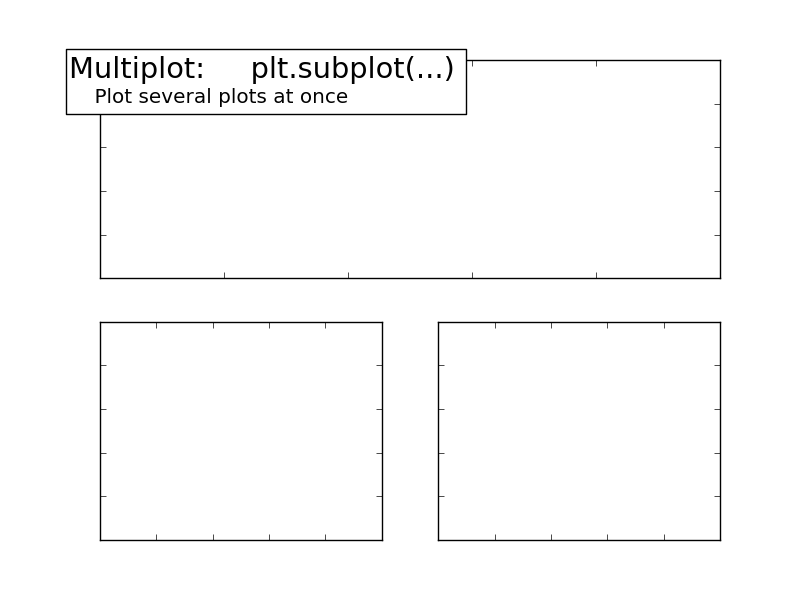
Python source code: plot_multiplot.py
import matplotlib.pyplot as plt

ax = plt.subplot(2, 1, 1)
ax.set_xticklabels([])
ax.set_yticklabels([])

plt.text(-0.05, 1.02, "Multiplot:     plt.subplot(...)\n",
      horizontalalignment='left',
      verticalalignment='top',
      size='xx-large',
      bbox=dict(facecolor='white', alpha=1.0, width=400, height=65),
      transform=ax.transAxes)
plt.text(-0.05, 1.01, "\n\n    Plot several plots at once ",
      horizontalalignment='left',
      verticalalignment='top',
      size='large',
      transform=ax.transAxes)

ax = plt.subplot(2, 2, 3)
ax.set_xticklabels([])
ax.set_yticklabels([])

ax = plt.subplot(2, 2, 4)
ax.set_xticklabels([])
ax.set_yticklabels([])

plt.show()
Total running time of the example: 0.20 seconds ( 0 minutes 0.20 seconds)
