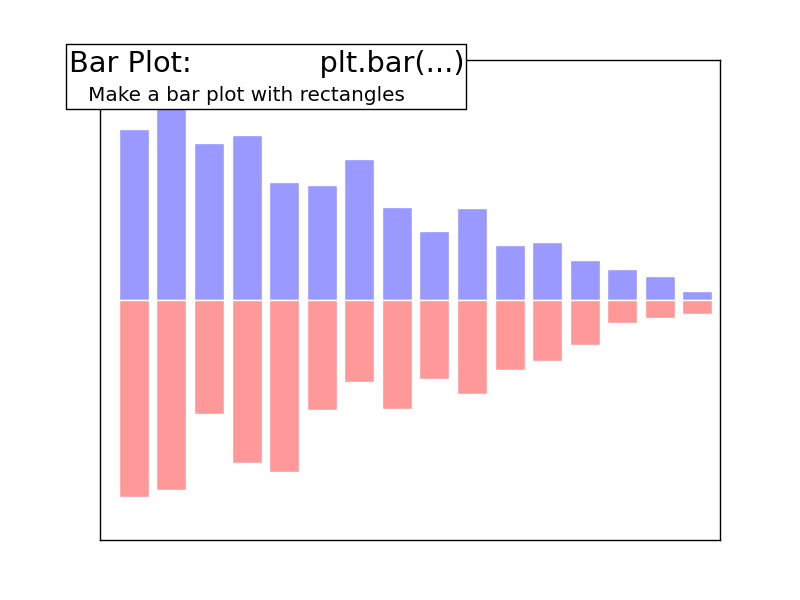
Bar plots display vertical or horizontal lines
Python source code: plot_bar.py
import matplotlib.pyplot as plt
import numpy as np

n = 16
X = np.arange(n)
Y1 = (1 - X / float(n)) * np.random.uniform(0.5, 1.0, n)
Y2 = (1 - X / float(n)) * np.random.uniform(0.5, 1.0, n)
plt.bar(X, Y1, facecolor='#9999ff', edgecolor='white')
plt.bar(X, -Y2, facecolor='#ff9999', edgecolor='white')
plt.xlim(-.5, n)
plt.xticks(())
plt.ylim(-1, 1)
plt.yticks(())

plt.text(-0.05, 1.02, "Bar Plot:              plt.bar(...)\n",
      horizontalalignment='left',
      verticalalignment='top',
      size='xx-large',
      bbox=dict(facecolor='white', alpha=1.0, width=400, height=65),
      transform=plt.gca().transAxes)

plt.text(-0.05, 1.01, "\n\n   Make a bar plot with rectangles ",
      horizontalalignment='left',
      verticalalignment='top',
      size='large',
      transform=plt.gca().transAxes)

plt.show()
Total running time of the example: 0.10 seconds ( 0 minutes 0.10 seconds)
