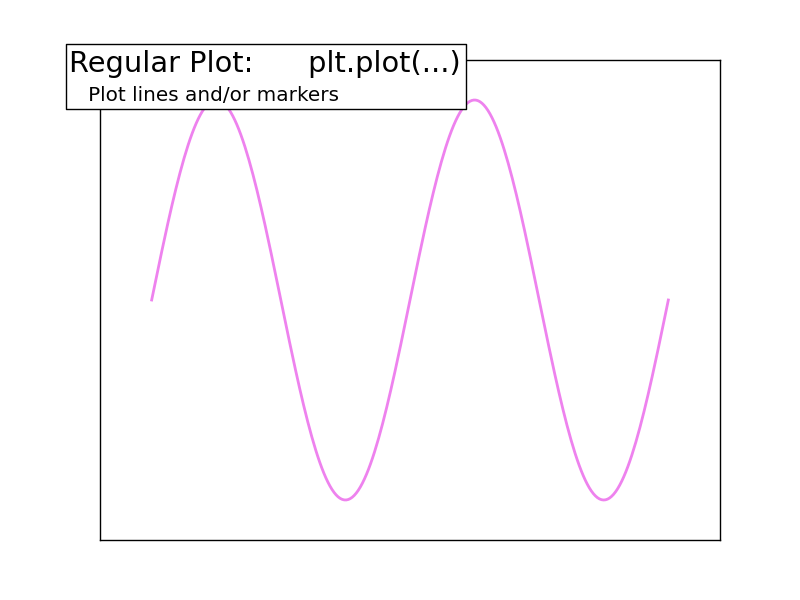
‘Regular’ plots plot one value ‘y’ as a function of another, ‘x’.
Python source code: plot_plot.py
import matplotlib.pyplot as plt
import numpy as np

X = np.linspace(0, 2, 256)
Y = np.sin(2 * np.pi * X)

plt.plot (X, Y, lw=2, color='violet')
plt.xlim(-0.2, 2.2)
plt.xticks(())
plt.ylim(-1.2, 1.2)
plt.yticks(())

plt.text(-0.05, 1.02, "Regular Plot:      plt.plot(...)\n",
        horizontalalignment='left',
        verticalalignment='top',
        size='xx-large',
        bbox=dict(facecolor='white', alpha=1.0, width=400, height=65),
        transform=plt.gca().transAxes)

plt.text(-0.05, 1.01, "\n\n   Plot lines and/or markers ",
        horizontalalignment='left',
        verticalalignment='top',
        size='large',
        transform=plt.gca().transAxes)

plt.show()
Total running time of the example: 0.53 seconds ( 0 minutes 0.53 seconds)
