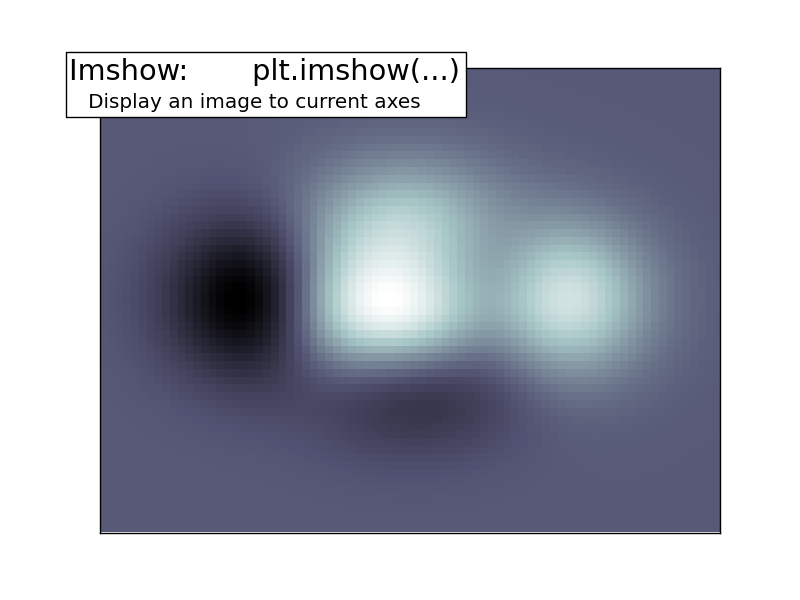
Imshow displays image-like data
Python source code: plot_imshow.py
import matplotlib.pyplot as plt
import numpy as np

def f(x, y):
    return (1 - x / 2 + x ** 5 + y ** 3) * np.exp(-x ** 2 - y ** 2)


x = np.linspace(-3, 3, 80)
y = np.linspace(-3, 3, 60)
X, Y = np.meshgrid(x, y)
Z = f(X, Y)
plt.imshow(Z, interpolation='nearest', cmap='bone', origin='lower')
plt.xticks(())
plt.yticks(())

plt.text(-0.05, 1.02, "Imshow:       plt.imshow(...)\n",
        horizontalalignment='left',
        verticalalignment='top',
        size='xx-large',
        bbox=dict(facecolor='white', alpha=1.0, width=400, height=65),
        transform=plt.gca().transAxes)

plt.text(-0.05, 1.01, "\n\n   Display an image to current axes ",
        horizontalalignment='left',
        verticalalignment='top',
        size='large',
        transform=plt.gca().transAxes)

plt.show()
Total running time of the example: 0.08 seconds ( 0 minutes 0.08 seconds)
