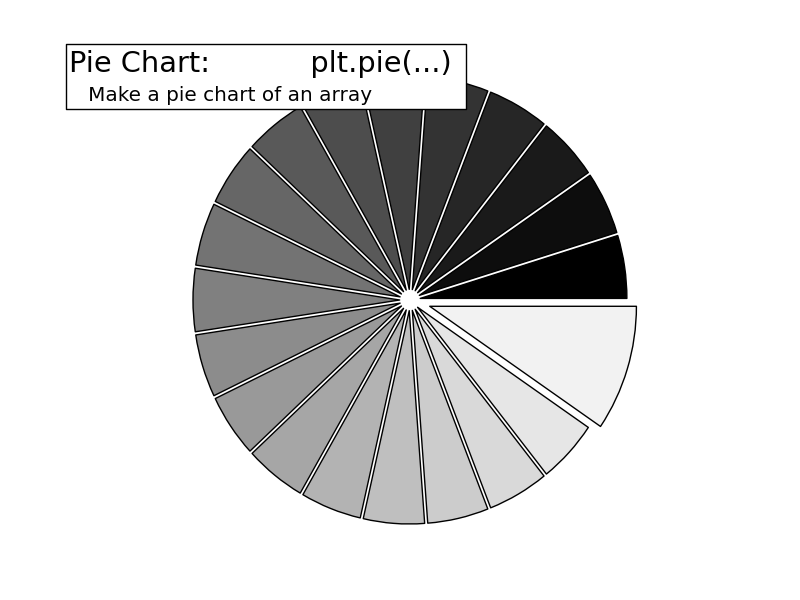
Pie plots look like pies.
Python source code: plot_pie.py
import matplotlib.pyplot as plt
import numpy as np

n = 20
X = np.ones(n)
X[-1] *= 2
plt.pie(X, explode=X*.05, colors = ['%f' % (i/float(n)) for i in range(n)])

fig = plt.gcf()
w, h = fig.get_figwidth(), fig.get_figheight()
r = h / float(w)

plt.xlim(-1.5, 1.5)
plt.ylim(-1.5 * r, 1.5 * r)
plt.xticks(())
plt.yticks(())

plt.text(-0.05, 1.02, "Pie Chart:           plt.pie(...)\n",
        horizontalalignment='left',
        verticalalignment='top',
        size='xx-large',
        bbox=dict(facecolor='white', alpha=1.0, width=400, height=65),
        transform=plt.gca().transAxes)

plt.text(-0.05, 1.01, "\n\n   Make a pie chart of an array ",
        horizontalalignment='left',
        verticalalignment='top',
        size='large',
        transform=plt.gca().transAxes)

plt.show()
Total running time of the example: 0.09 seconds ( 0 minutes 0.09 seconds)
