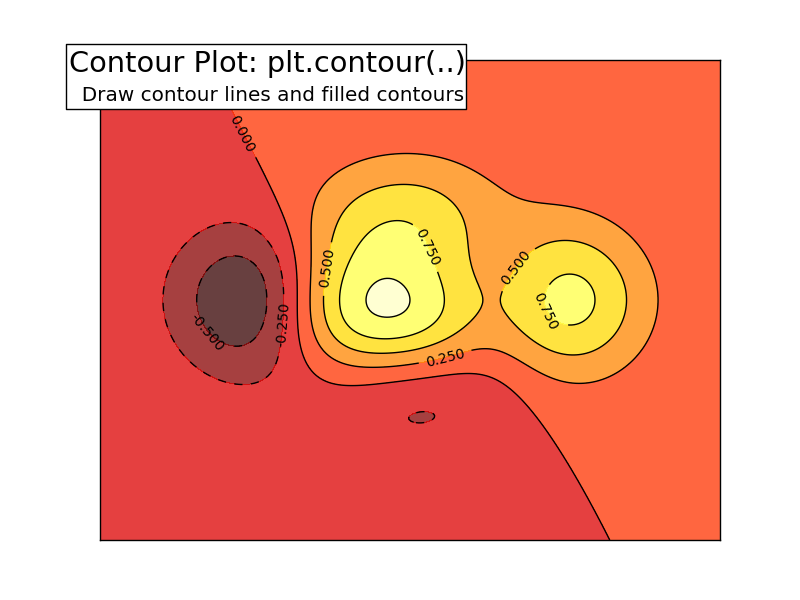
Contour plots draw iso-contours of 2D data.
Python source code: plot_contour.py
import matplotlib.pyplot as plt
import numpy as np

def f(x, y):
    return (1 - x / 2 + x ** 5 + y ** 3) * np.exp(-x ** 2 - y ** 2)

x = np.linspace(-3, 3, 256)
y = np.linspace(-3, 3, 256)
X, Y = np.meshgrid(x, y)

plt.contourf(X, Y, f(X, Y), 8, alpha=.75, cmap=plt.cm.hot)
C = plt.contour(X, Y, f(X,Y), 8, colors='black', linewidth=.5)
plt.clabel(C, inline=1, fontsize=10)
plt.xticks(())
plt.yticks(())

plt.text(-0.05, 1.02, "Contour Plot: plt.contour(..)\n",
      horizontalalignment='left',
      verticalalignment='top',
      size='xx-large',
      bbox=dict(facecolor='white', alpha=1.0, width=400, height=65),
      transform=plt.gca().transAxes)

plt.text(-0.05, 1.01, "\n\n  Draw contour lines and filled contours ",
      horizontalalignment='left',
      verticalalignment='top',
      size='large',
      transform=plt.gca().transAxes)

plt.show()
Total running time of the example: 0.16 seconds ( 0 minutes 0.16 seconds)
